Instead of using the public IP address, use the service name (if they are on the same Docker Compose network) or the IP address of the internal Docker network. Using the public IP address from within Docker can sometimes cause routing problems (“hairpin NAT”)
run the command (in server):
ip addr show docker0search the ip:
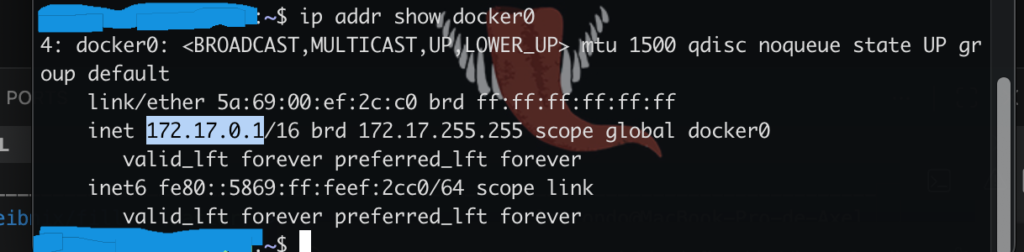
in my case is:
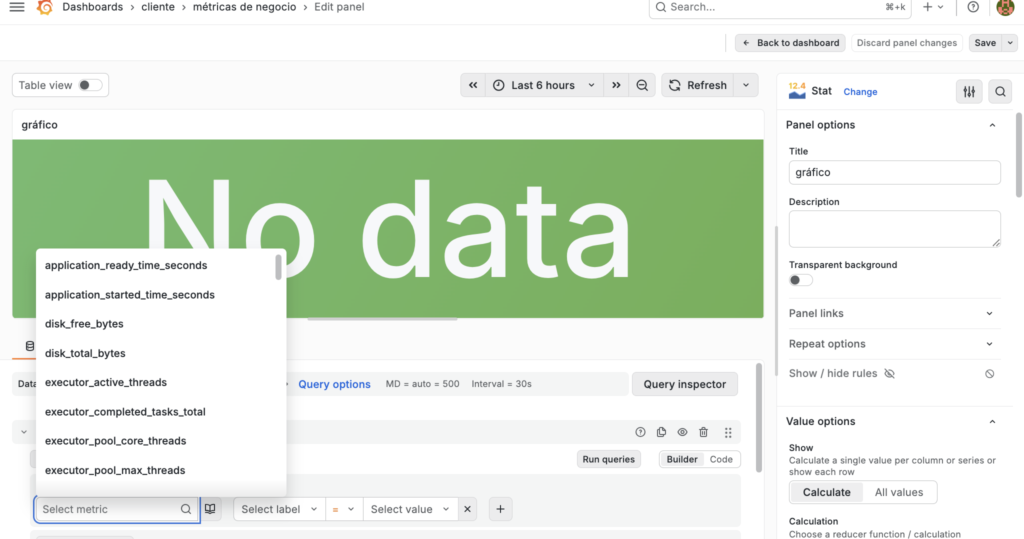
172.17.0.1inside of the dashboard, in the panel, set “Data Source” with “Prometheus”
That’s where Grafana gets the data from
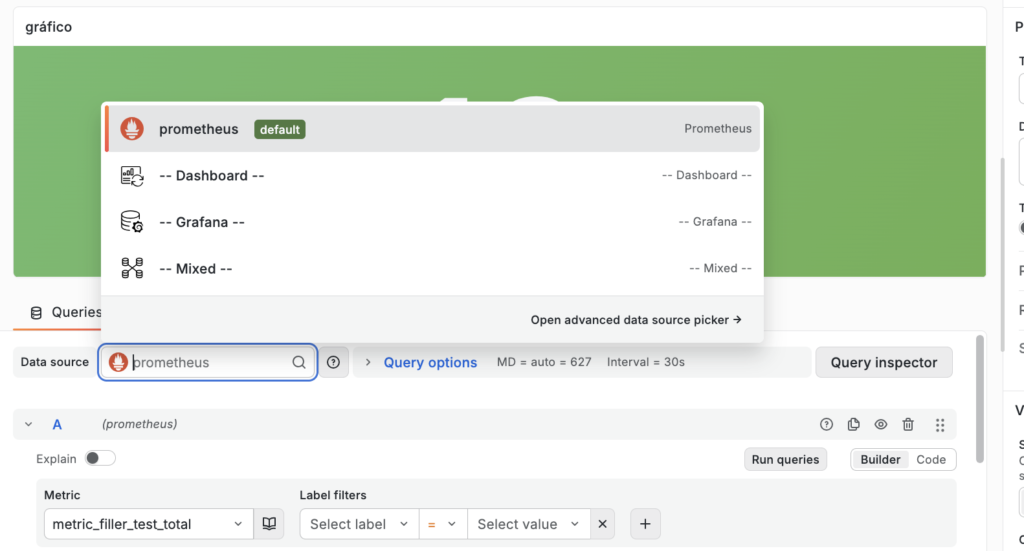
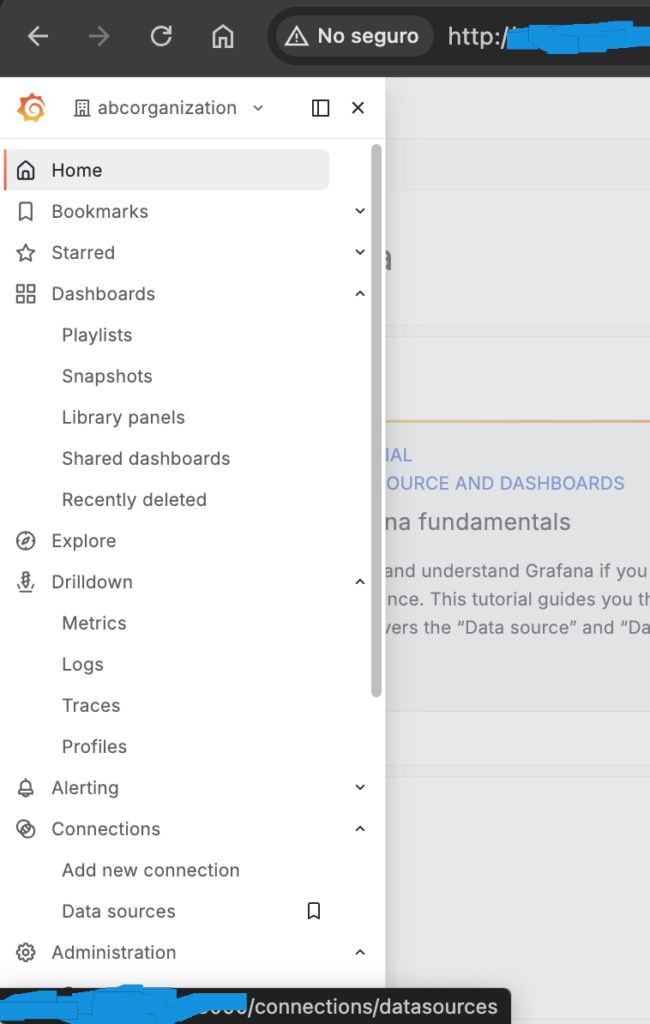
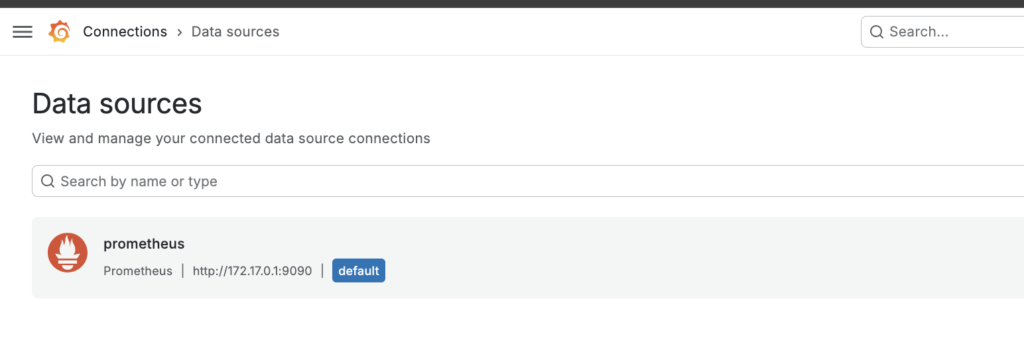
configure in grafana, prometheus as datasource
Another thing you need to configure in Prometheus is the URL where the data comes from
Prometheus usually runs on port 9090
If Grafana is run in Docker, you’ll have problems with the public URL and localhost, since it runs in a container and has a separate network
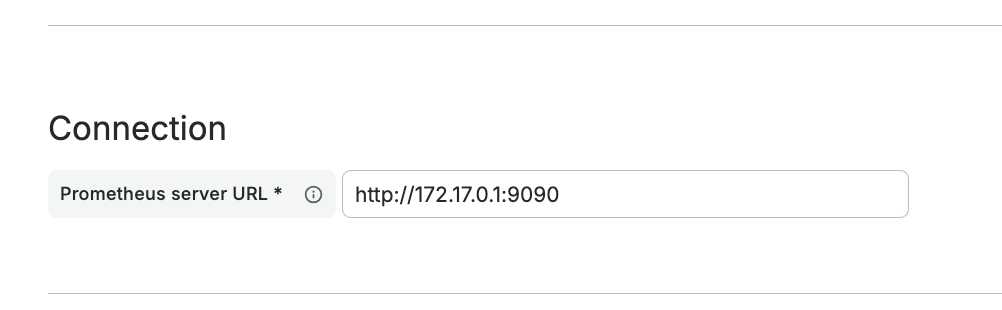
In the URL field you must enter the IP address found earlier and the port 9090:
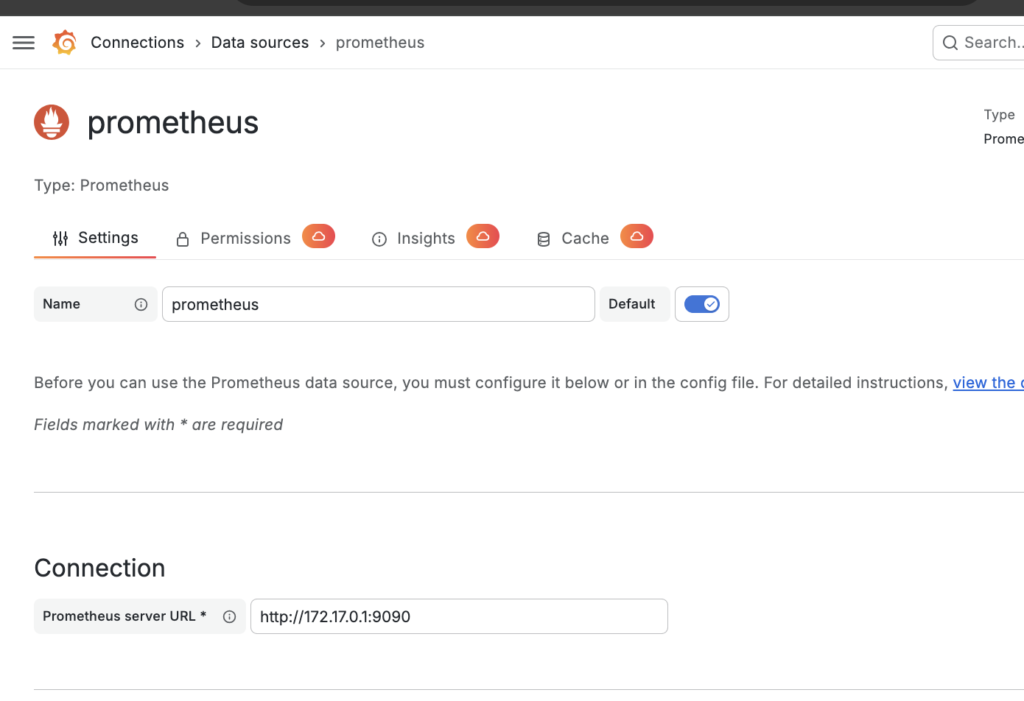
in prometheus url put:
http://172.17.0.1:9090
and save it!
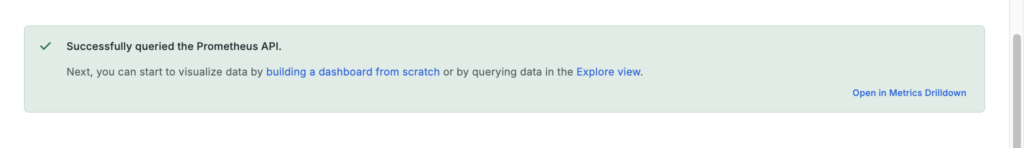
then, you can see the metric: