I was experiencing an issue where Prometheus persisted information, but it displayed the metric without the increase() function, so it didn’t show the accumulated data
If you only put the metric in Grafana, it shows the current values of the metric; you must use the sum() and increase() functions in Grafana to make it an accumulation of values
Micrometer does not persist data (it only stores it in memory), Prometheus collects data from Micrometer and then Grafana draws the data
Grafana only draws the data that Prometheus has; Micrometer is ephemeral (it only stores data in memory, it does not persist)
Therefore, Prometheus is the only one that persists data (it should work perfectly)
To make Prometheus persist data and you’re using Docker, you must use the volumes section in Docker Compose
services:
  micrometer:
    image: mi-app-custom
    container_name: javaappandmicrometer
    ports:
      - "8090:8090"
  prometheus:
    image: prom/prometheus:latest
    container_name: prometheus
    ports:
      - "9090:9090"
    volumes:
      - ./prometheus.yml:/etc/prometheus/prometheus.yml
      - ./prometheusdata:/prometheus
    command:
      - '--config.file=/etc/prometheus/prometheus.yml'
      - '--storage.tsdb.path=/prometheus'
    extra_hosts:
      - "host.docker.internal:host-gateway"
    user: "root" # Ayuda con problemas de permisos en los volúmenes de Linux
    restart: unless-stopped

  grafana:
    image: grafana/grafana-oss:latest
    container_name: grafana
    ports:
      - "3000:3000"
    volumes:
      - grafana_data:/var/lib/grafana
    environment:
      - GF_SECURITY_ADMIN_PASSWORD=admin # Cambiala luego
    restart: unless-stopped

volumes:
  prometheus_data:
  grafana_data:
see the section:
    volumes:
      - ./prometheus.yml:/etc/prometheus/prometheus.yml
      - ./prometheusdata:/prometheus
- prometheus.yml is a file in your computer
- prometheusdata is a directory
- ./ means current location
- at the right is location of docker container
in the same location:
- docker-compose.yml (file)
- prometheudata (folder/directory)
- prometheus.ym (file)
as you see in image:

in the prometheusdata directory:

inside of “chunks_head” directory:

Files containing Prometheus data (persistence) are stored there:

I believe the data is binary (and Prometheus reads it)
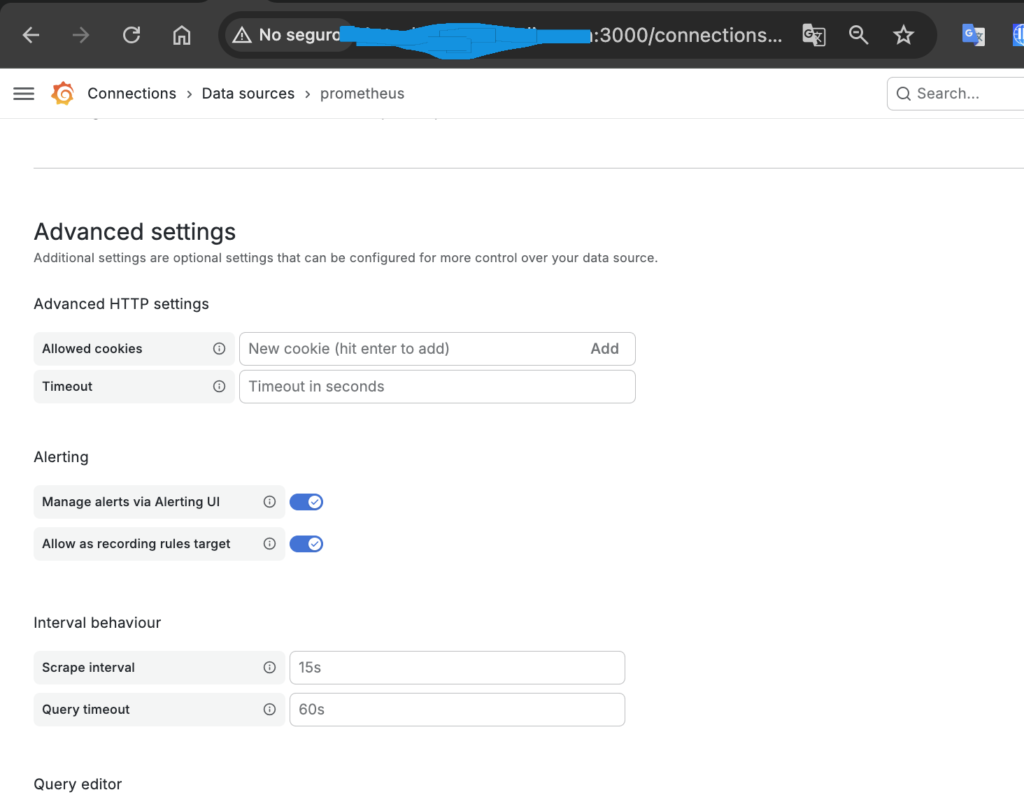
scrape
The Scrape Interval is the frequency or “rhythm” at which Prometheus requests data from your applications
If we think of it like a medical checkup, the scrape interval would be how often the doctor takes your pulse. If it’s every 15 seconds, you’ll get a very detailed graph; if it’s every hour, you’ll miss what happened in between
Prometheus is a “pull” based system. This means that your applications don’t constantly send data to Prometheus; instead, Prometheus “pulls” the data (scrapes it)
Alignment with Grafana: If your scrape interval is 1 minute, refreshing the Grafana panel every 5 seconds won’t help much, because the data won’t have changed
Downtime detection: If Prometheus attempts to scrape and the application is unresponsive, it will mark the up metric as 0. If the interval is very long, it will take longer to find out that a service has gone down
Accuracy vs. Performance: A very short interval (e.g., 1s) gives you near real-time metrics, but consumes more CPU, bandwidth, and disk space
the configuration file:
prometheus.ymlcontent:
scrape_configs:
  - job_name: 'spring-boot-app'
    metrics_path: '/actuator/prometheus'
    scrape_interval: 5s
    static_configs:
      - targets: ['javaappandmicrometer:8090']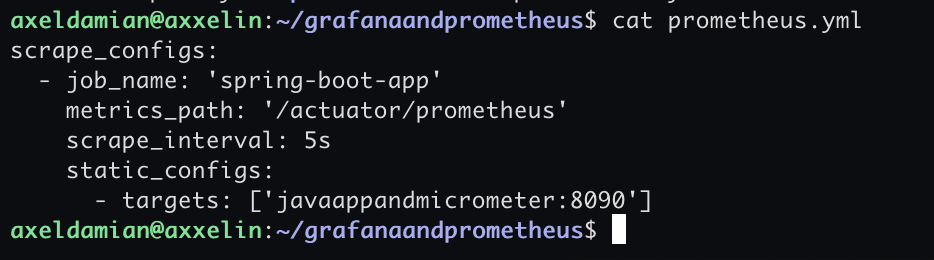
- /actuator/prometheus is the endpoint where prometheus search data from micrometer
- scrape_interval: 5s (each 5 second prometheus search information in /actuator/prometheus endpoint
- javaappmicrometer (is the java app and micrometer)
The scrape is done in two places:
- prometheus.yml (file in the OS)
- prometheus configuration web of grafana
Both are valid, but they control entirely different things. It’s not that one “wins” over the other, but rather that they operate at different points in the data’s lifecycle
For everything to run smoothly, ideally the value in Grafana should be equal to or greater than the value in prometheus.yml
web:
file:
the data persists in prometheus if you see:
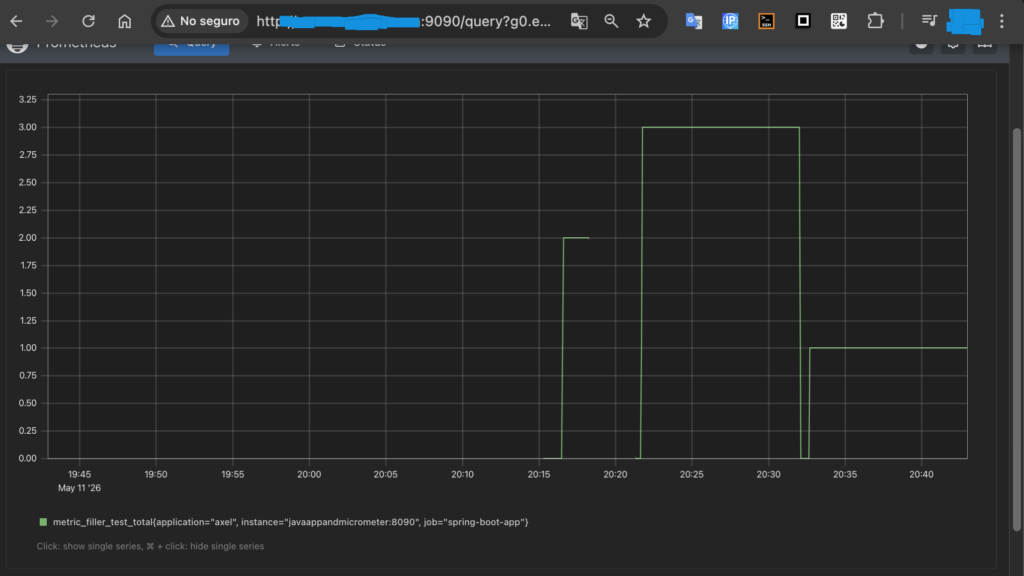
Prometheus (9090) is fed by application data (on its specific port, in my case 8090) and the endpoint /actuator/prometheus (the data there is stored in memory while the app is running) (when the app is not running the data in actuator/prometheus is reset to 0)
In the Prometheus graph, you can see that the counter resets to 0 twice and the graph is cut off once; that’s because the app stops running
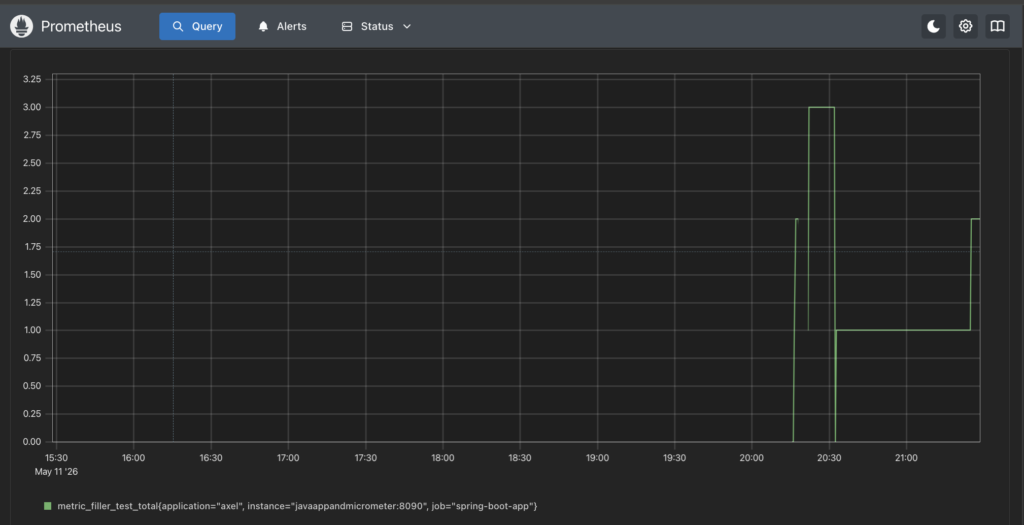
In the graph above, the values 2 (after the app son’t run), 3, 1, and 2 are reached. Each of these values is reached after the counter is reset to 0
The fact that it can see past values and then reset those values to 0 means that Prometheus persists information
in grafana you can see the accumulation:
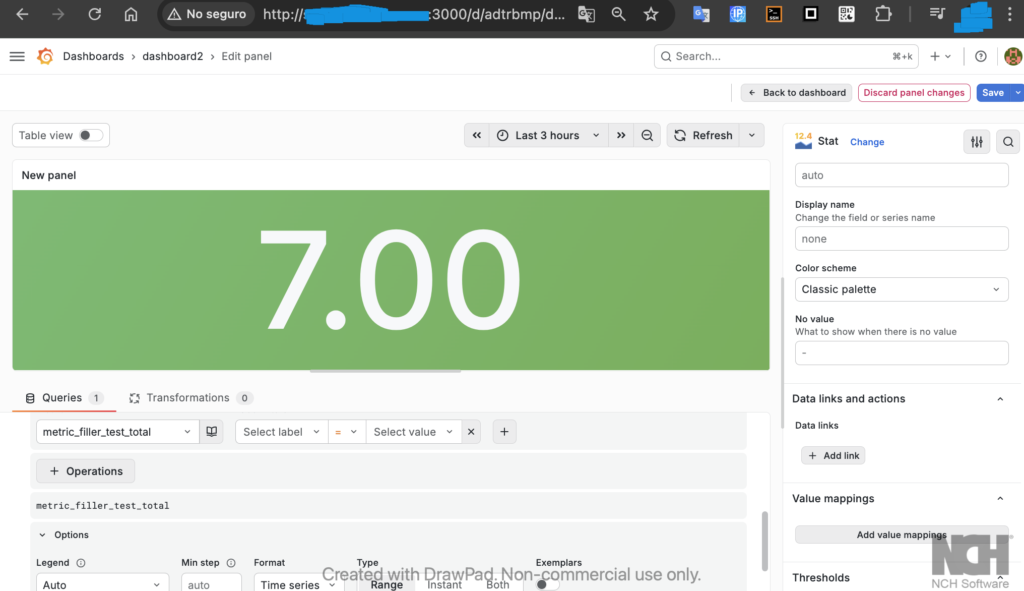
You must select the metric in “metric” and then in “operations” select the increase() function (in range functions):
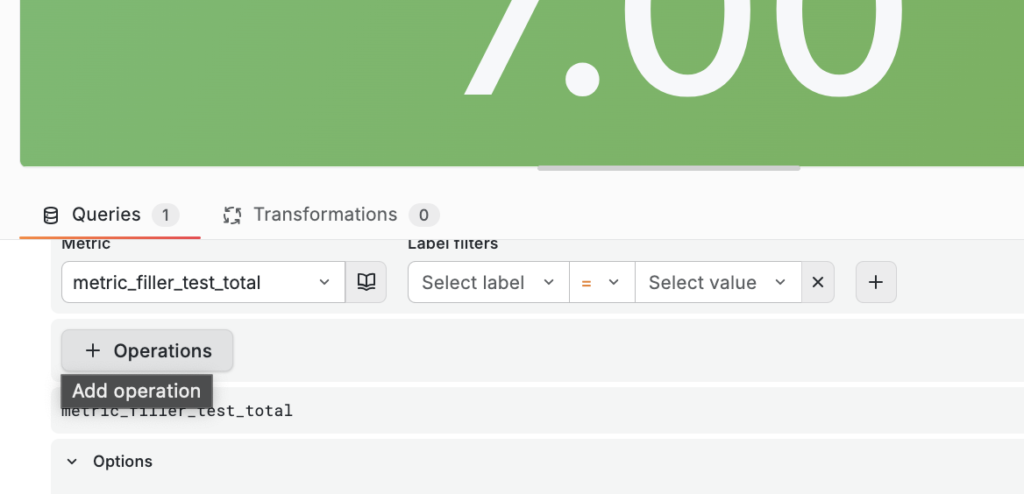
You can create an accumulator or counter as follows:
with operations:
- sum()
- increase()
um(increase(metric_filler_test_total[24h]))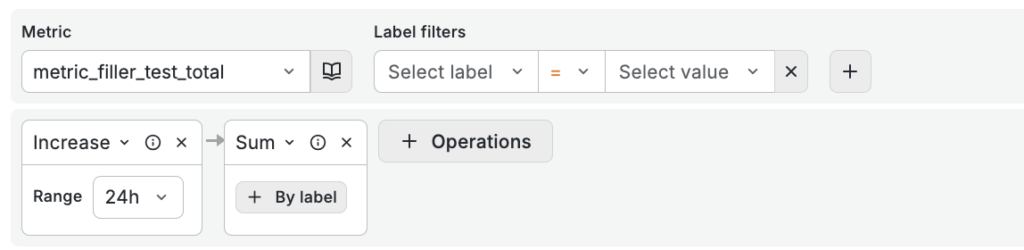
The number displayed on the Grafana panel is an accumulation of data
the query is:
sum(increase(metric_filler_test_total[$__full_range]))