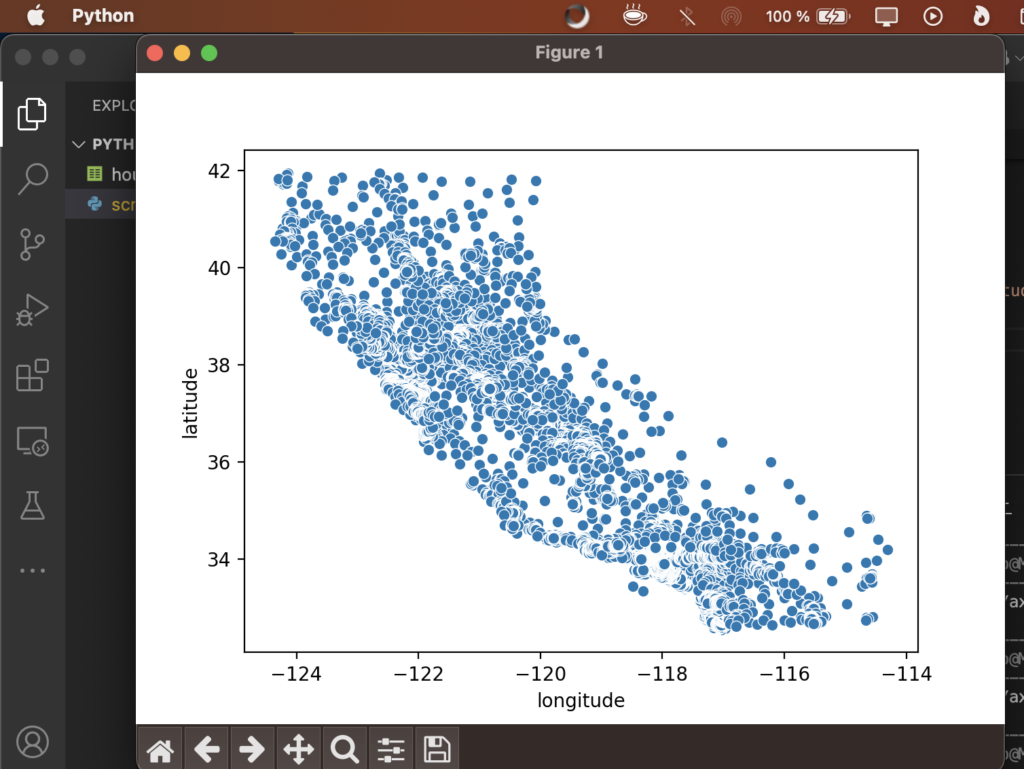
the code is:
import pandas as pd
import seaborn as sb
import matplotlib.pyplot as plt

data = pd.read_csv('housing.csv')

sb.scatterplot(data=data, x='longitude', y='latitude')

plt.show(block=True)
Obviously you should have a CSV with data called ‘housing.csv’ located in the same place where the Python code is.
it looks like this
